
Back in 2017, my to-be eldest step-son, Matthew released his first YouTube video in hopes of one day becoming a YouTuber, like those he follows.
At the beginning of November, we started an experiment. In the 2 years, 9 months he had his channel, his gameplay vids would garner an average of 10 views, earning him a total of 123 subscribers.
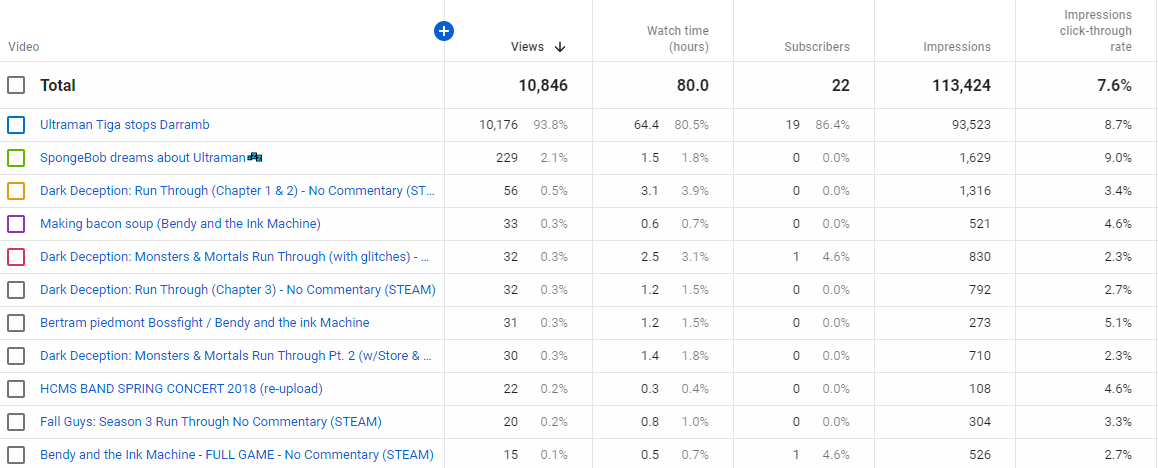
The vast majority of his subscribers and views have come from his mash-up videos involving the Japanese superhero Ultraman, with the most views coming from his short video involving Ultraman Tiga and villain Darramb, at 15,675 views. His most successful subscriber video is his mashup with SpongeBob and Ultraman, garnering him 29 subs (as of the time of this post).
Although he does have a mix of blog content, game fan content, and gameplay (primarily mobile), we wanted to see what consistency and tagging would do for his channel.
On November 5th, 2020, we recorded and I edited his first Steam “Fall Guys Season 2 Run Through” and launched it on YouTube (seen above). Because we hadn’t decided on a hard launch date/time for vids and tags, the analytics were a bit off. As of the writing of this post, it has garnered 27 views within 55 days. Tags and a promo tweet from mine and Matthew’s Twitter account were sent out. Here are the stats:
| name | launch | days active | views | Twitter Impressions | YouTube Impressions |
| Fall Guys S2 Pt. 1 | 11/5/2020 | 55 | 27 | 109 | 521 |
Column 6: YouTube’s engagement rate was 3.86% (20 imp click-through/521 imp).
After the launch of this video, we decided to try launching his videos every week on Fridays at 12:15 PM ET, moving forward, and tagging the videos to create some consistency. I would go through google trends to see what searches people were using in association with the video content.
From my previous research on the YouTube algorithm, I know consistency on launch date and content are highly favored, and the more people watch until the end, the more YouTube will add your videos to YouTube’s suggested videos box, which will garner more viewership. Also tags actually associated with the video (avoiding bait/switch thumbnails, titles, or tags) helped boost impression rates on the YouTube platform.
The next video that we launched was “Dark Deception: Monsters & Mortals Run Through”. Here are the metrics:
| name | launch | days active | views | Twitter imp | YouTube Imp |
| DD:M&M Pt.1 | 11/13/2020 | 47 | 92 | 928 | 1700 |
Column 6: YouTube click Through was 56/YouTube Impressions = 3.29% engagement rate.
One of the benefits of this video’s popularity was that it was released 11 days after the game was released on STEAM, so this game was trending in it’s category, sweeping Matthew’s video with it.
Within our research, an anomaly occurred in the promotion of one of our videos. “Bendy and the Ink Machine – Full Game” (shown above) never received a tweet from Matthew nor me. It was an ironic occurrence since we had so many issues with this video, to begin with, and although the failure to promote this video was not intentional, it did offer us some insight regarding Twitter promotion discrepancies, if it were to occur again. Regardless of the lack of promotion, it still received the hashtag treatment on YouTube and garnered the following numbers:
| name | launch | days active | views | YT Imp | YT Click-thru | YT Engage |
| Bendy | 11/27/2020 | 33 | 29 | 676 | 20 | 2.96% |
Although this video is by far our longest (1:38:14 run time), out of all the videos we had launched, even without the backing of Twitter, it was not on the bottom of the list of lowest impressions. That still went to our first Fall Guys video.
Currently, our most popular video, based on views/days active, would be our most recent “Fall Guys: Season 3 Run Through” (above), which has so far garnered 20 views in 6 days (average 3.3 views/day) was released on Christmas, and just like our Dark Deception: Monsters & Mortals pt. 1 video, this video was released within 10 days of the Fall Guys Season 3 release, allowing it to ride the wave of popularity of the release while also benefitting from the Christmas holiday.
Based on the 8 videos we launched, all within the video game run through genre, here are the best/worst metrics:
| name | launched | active | views | views/live | tweet eng/imp | YT click-thru/imp |
| Fall Guys S2, pt.1 | 11/5/2020 | 56 | 27 | 0.48/day | 3.67% | 3.84% |
| Fall Guys S2, pt.2 | 11/20/2020 | 41 | 33 | 0.80/day | 0.85% | 2.83% |
| DD: M&M pt. 2 | 12/4/2020 | 27 | 30 | 1.11/day | 1.72% | 2.22% |
| Fall Guys S3 | 12/25/2020 | 6 | 20 | 3.33/day | 2.72% | 3.07% |
Least: Fall Guys S2, pt. 1 per day view average, Fall Guys S2, pt.2 twitter engagement percentage, Dark Deception: Monsters & Mortals Pt. 2 YouTube engagement.
Here’s perhaps the most interesting thing:
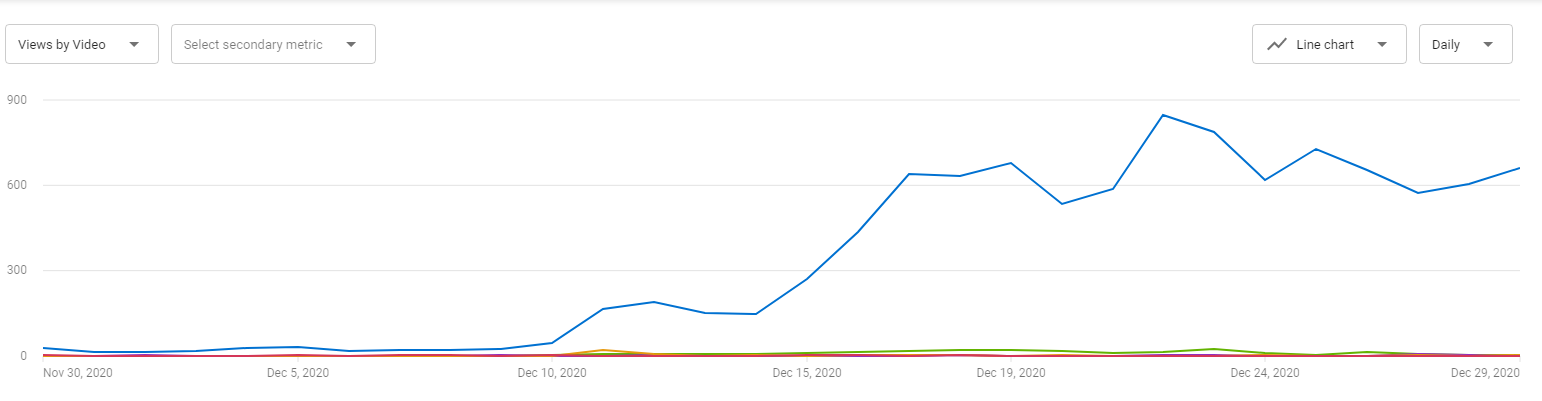
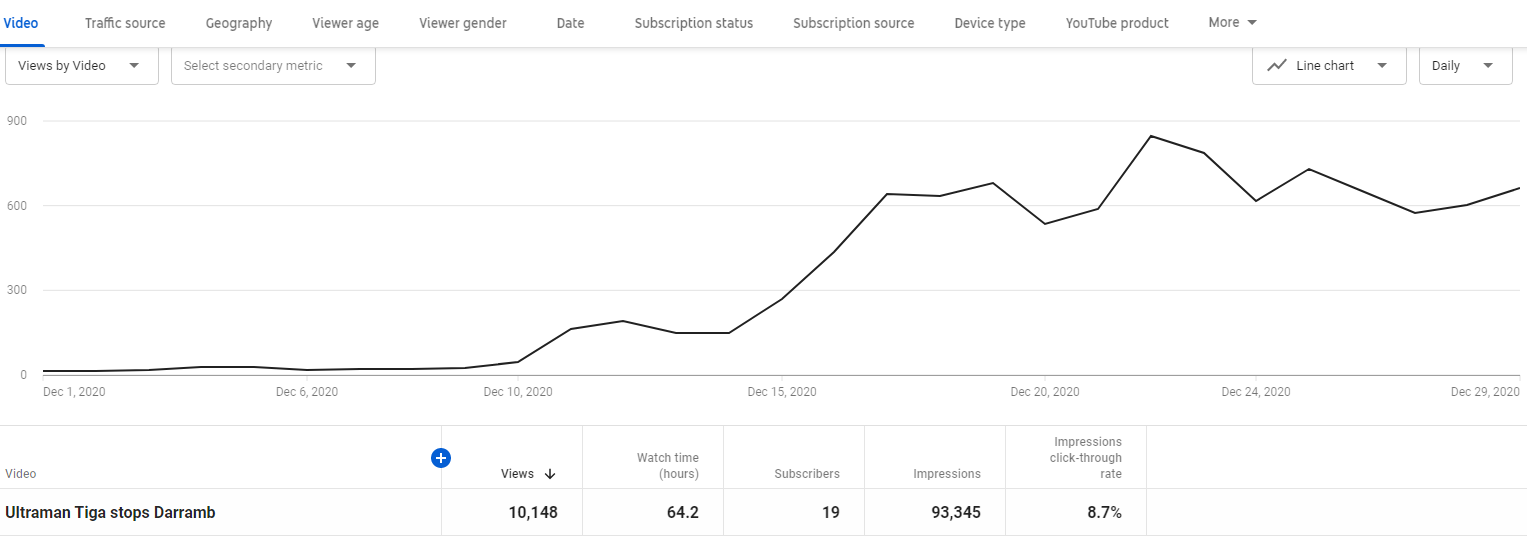
Almost a month after we started doing this, the entire channel started to get attention. Although Matthew’s “Ultraman Tiga stops Darramb” was released in 2018, and is still his most popular video (before Dec 10th @ 5,527 views), it has only been since December 10th that this video received a 283.61% boost (10,148 new views).
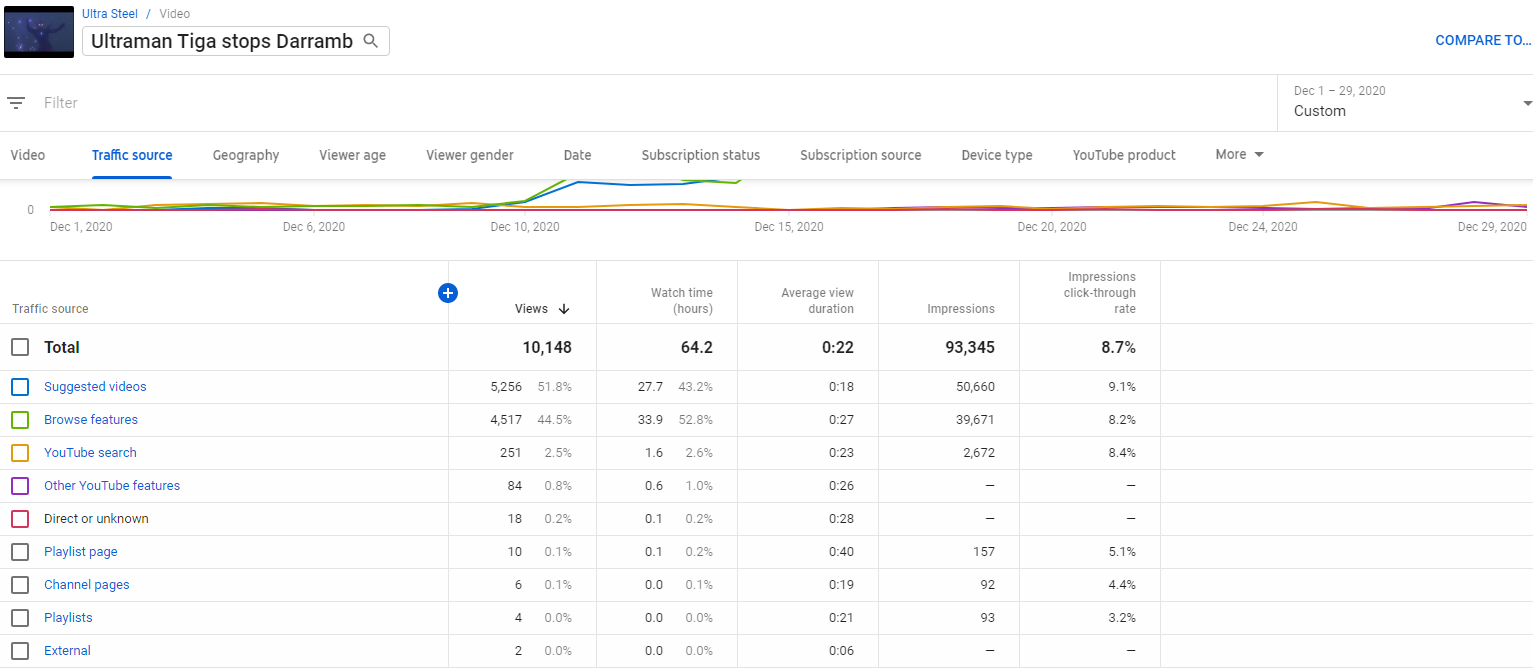
Keeping the same date metrics, we wanted to see if this was coming from any timely occurrence like the release of a movie, video game, etc that would have influenced these numbers, as it did our previously mentioned popular releases, however, it wasn’t the case. Per YouTube, the bulk, 52% of the new views came from YouTube’s internal “Suggested Videos” listing, while YouTube’s “Browse Features” provided 45% of these views, making YouTube’s internal promotion responsible for 96% of these views. External, YouTube search, and Direct would have been higher, had the traffic been based on a product launch.
Does this mean that external promotion is pointless? Would the boost have happened, regardless of our experiment? Doubtful. From what it looks like, due to the consistency of the content we’ve been launching, and the tagging, the overall channel has received a boost, although some content has received more than others, the oldest public videos within the top ten (more than 2 months old) have seen the following boost:
| Name | Pre 12/1 | 12/1 + | change |
| Ultraman Tiga Darramb | 5527 | 10148 | 283.61% |
| SpongeBob Ultraman | 6412 | 299 | 4.66% |
| Bacon Soup | 293 | 125 | 70.1% |
| Betram Bossfight | 132 | 31 | 23.48% |
Also, within the top 10, five of the videos have been released within the last two months. Because of the YouTube algorithm, not all videos have received the same boost on the channel. We know that tagging and titling are important, as well as user viewership. Timeliness also is a factor.
It’ll be interesting to see how these numbers will play out in the coming months.
Stay Tuned.